The following sections describe how to use various aspects of the Macro Tools with step-by-step directions. Each document gives the user specific instructions for accomplishing intermediate tasks within the Macro Tools. Additionally, instructions are provided to download data from the Macro Tools in order to analyze them outside of the Macro Tools along with an example analysis performed in Microsoft Excel.
Macro Tool Navigation
Provides the basics for navigating the Macro Tool suite.
How-to Access and Analyze Bottlenecks
Users will learn how to access and analyze bottlenecks. This allows the viewing and analysis congestion within the Macro Tools. The document will show you how to access bottlenecks and download data for additional processing outside of the Macro Tools.
How-to Download Performance Measures
Data from the Macro Tools is available to download in both .comma-separated values (.csv) and .shape files (.shp) using the Data Downloader. The document provides step-by-step instructions for using the Data Downloader.
Composite Score Tutorial
Learn how to create a scoring mechanism in Excel that normalizes and compares multiple downloadable performance measures.
Macro Tool - Data Measures
This document lists all the data measures available inside the NPMRDS tool suite.
Introduction
The Macro Tool provide users with a map interface where they can visualize a variety of transportation data geographically. The Macro Tool is a great tool to start your analysis. It is best for ranking the segments in your region, it provides an easy export option for looking at the entire collection of segments in your region, and for exporting a variety of different measures for each segment.
The Macro Tool currently provides data at the year aggregation only. Users can view and export a single score per measure for a given year that is either summed, averaged, or as a ratio of averages or percentiles, depending on the specific measure. The Macro export tool allows a user to download all possible measures and a variety of metadata for each segment in the selected region, by TMC ID or via the NYS Road Inventory System (RIS) network IDs or OpenStreetMap network.
The basics of navigating the map interface and what each of the functions provided by the menus are described below.
Contents
- Navigating the Map
- Changing the Base Map
- Functions of the Right Side Panel
- Functions of the Left Side Panel
Navigating the Map
Zooming
Zoom in and out by scrolling the mouse wheel or using the "+" and "-" buttons in the bottom right corner of the map.
Panning
To pan, click and hold anywhere on the map. Drag the cursor in the direction that you want the map to move the map.
Rotating
To rotate, click and hold the black and grey triangle symbols in the bottom right corner of the map. Drag the cursor to the left or right to rotate the map. Clicking the button once will return the map to the default orientation.
Tilting
Clicking and holding the right mouse button will allow users to rotate by dragging left and right or tilting by dragging up and down.
Changing the Base Map
You can change the base map to display a different background, such as satellite imagery or light and dark themes by clicking the map button at the top of the Macro View menu.

From here, choose the desired map background.

Clicking the "Layer" icon to returns to the previous menu.

Functions of the Right Side Panel
The Right Side Panel allows the user to view and select a multitude of parameters for the user to explore using the map. Drop down menus for Geography, Network, Year, Compare Year, and Performance Measure form the basis of any analysis taking place in the Macro Tool. Options can be chosen by selecting from each drop down menu. Geography allows one or multiple geographies to be selected as the bounds for analysis. Most Performance Measures offer a variety of sub-options for more granularity:
- Freeflow (miles per hour)
- Level of Travel Time Reliability (LOTTR)
- Total and by Peak
- Level of Truck Travel Time Reliability (TTTR)
- Total and by Peak
- Peak Hours of Excessive Delay (PHED)
- Person and Vehicle Hours
- Total and Per Mile
- Cars, Trucks, and Combined Cars and Trucks
- Total Hours of Excessive Delay (TED)
- Person and Vehicle Hours
- Total and Per Mile
- Cars, Trucks, and Combined Cars and Trucks
- Planning Time Index (PTI)
- Total and by Peak
- Travel Time Index (TTI)
- Total and by Peak
- Percentage of Epochs Reporting
- Total and by Peak
- Emissions CO² All Vehicles
- Fuel Type
- Pollutant Type
- Total and by Peak
- Percentile Speed
- Total and by Peak
- Transit AADT
- RIS Attributes
- TMC Attributes
Once the parameters have been set, the map will update to display them. TMCs on the map can be hovered over to display the following in the tool tip:
- At the top of the box is the route name and/or number
- TMC: The unique 9 digit value identifying the TMC segment.
- Functional Class
- FRC: The class or group of roads to which the road belongs (assigned by TMC Consortium).
- Interstate
- Principal Arterial – Other Freeways and Expressways
- Principal Arterial – Other
- Minor Arterial
- Major Collector
- Minor Collector
- Local
- AADT: Annual Average Daily Traffic
- Length: The length of the TMC Segment along the road in miles.
- Epoch Reporting (%): Percentage of epochs reporting data in Total, AM, Off, and PM.
- Performance Measure: This will display the calculation for whichever "Performance Measure" is selected in the Left Side Panel.
Functions of the Left Side Panel
The Left Side Panel allows the user to search for TMCs, access one of four Infoboxes, and open the data downloader. Selecting the TMC Search bar will open a menu that will allow for individual TMC segments to be found based on their IDs. Infoboxes can be added from the "Add Infoboxes" drop down menu, and removed by clicking the "X" in the top right corner of the Infobox. There are four Infoboxes available: Measure Definition, Bottlenecks, Regional Overview, and Transcom Incidents. Of these, two will display data on the map (Bottlenecks and Transcom Incidents). Hovering over these items on the map will provide the user with additional information specific to that data point (More information about what each of these fields are can be found in the Data Dictionary section of our documentation). The Measure Definition Infobox will display information related to the Performance Measure currently selected on the Right Side Panel, while the Regional Overview Infobox will display a regional overview of the Performance Measure currently selected.
The Bottlenecks and Transcom Infoboxes will populate the map with the following data:
Bottlenecks
Hovering over a Bottleneck will pop-up a box that displays:
- TMC: The unique 9 - digit value identifying the TMC segment.
- Roadname: The common route name and/or number
- Direction: The direction of the route's traffic flow.
- Region: NYS Department of Transportation (NYSDOT) Region number
- Rank: This is the rank in comparison to other bottlenecks (based on)
- Percentile
- Measure
- VMT: Vehicle Miles Travelled - AADT for the segment multiplied by the distance of the segment. (maybe multiplied by 365)
- Radius
- Color
- Type
- Hoverlayer
Transcom Incidents
Hovering over a Transcom Incident will pop-up a box that displays:
- Event ID
- Category
- Color
- Open Time
- Vehicle Delay
- Type
- Hoverlayer
These can be viewed on the map and interacted with both inside the Macro Tools and outside, using the Data Downloader and appropriate tools.
Introduction
Accessing and analyzing bottlenecks can be done through the Left Side Panel in the Macro Tools. As described in the Map and User Interface Navigation documentation, when selecting the Bottlenecks Infobox, the traffic bottlenecks in your selected geography will be displayed on the map. This allows you to view, rank, and analyze the worst congested locations at different levels of geography completely within the Macro Tools. Multiple measures of congestion, time, and networks can be selected for analysis. The steps below will show you how to access bottlenecks and download data for additional processing outside of the Macro Tools as a .json or .shp file.
Accessing Bottlenecks
Selecting Geographic Bounds for the Macro Tool
Click on the "Macro" button located on the left side navigation to open the map.

It is important to set the geography within which to analyze bottlenecks. Using the Left Side Panel, select the "Geography" drop down menu to display a scrollable list of the available geographies. The desired geography (or geographies!) can be selected either by using the search bar or scrolling through the list. Once a geography has been selected, the map will zoom to the geography. If multiple geographies are desired, click the drop down menu again and repeat the process to include as many as needed. There are many different geographies to choose from, so explore the list! The most common will be the County or Metropolitan Planning Organization (MPO) boundaries.

The Geography Drop Down Menu
Choosing Performance Measures for Bottlenecks
Once the geography has been set, it is time to select the desired performance measures. In the Left Side Panel, you can apply a variety of different congestion measures to perform your analysis, including: PHED (Peak Hour Excessive Delay), TTTR (Truck Travel Time Reliability), LOTTR (Level of Travel Time Reliability). Click the "Performance Measures" drop down menu on the Left Side Panel to open a drop down displaying the different performance measures. A performance measure can be selected by clicking on it in the list. Once a performance measure has been selected, the map will update itself to display the bottlenecks for the selected performance measure. Some performance measures allow for further granularity, such as the selection of time, vehicle type, network type, the addition of comparison years, and others. More on performance measures can be found in the Map and User Interface Navigation and Data Measures (All) documentation.

The Performance Measure Drop Down Menu
Access Bottlenecks via the Macro Tool
In order to view Bottlenecks on the map, click "Add Infobox" under the legend on the Right Side Panel and select "Bottlenecks".

Adding the Bottlenecks Infobox
With the Bottleneck Infobox selected, the map displays location markers for each bottleneck in the table. Each location has weighted circle mark and that will display detailed information when the cursor hovers over it. Hovering over a bottleneck in the list will highlight its corresponding circle on the map.
Additionally, a table will populate on the Right Side Panel showing a list of the Top 30 Bottlenecks in the selected geography. The table gives the name of the bottleneck, the TMC, the chosen performance measure value (val), vehicle miles traveled (vmt), and the percent of epochs reporting data (% rpt). it shows the names of worst congested road segment sorted by ranking of ATRI's Total Freight Congestion Values in a given month. There are 4 other congestion measures (chenea, phed, tttr, lottr) available, which will be discussed further on in this tutorial. The Top 30 Bottlenecks data can be downloaded as a .shp or .json file by clicking the text button corresponding to the desired file type, and clicking "OK" in the pop-up window.
Downloading the Data
The Top 30 Bottlenecks data can be downloaded as a .shp or .json file by clicking the text button corresponding to the desired file type, and clicking "OK" in the pop-up window.

Once downloaded, these files can be opened for further analysis using appropriate tools.
Introduction
Data from the Macro Tools is available to download in both .comma-separated values (.csv) and .shape files (.shp). Exporting data allows deeper analyses using external software and tools. The Data Downloader allows users to identify Performance Measure and Metadata variables that are valuable to them and then export those data to .csv files to be used in spreadsheets or .shp files that are useful in geographic information system software. The document provides quick step-by-step instructions for using the Data Downloader. Information on which Performance Measures are available can be found in the Macro Tools and Data Measures (All) documentation. The Map and User Interface Navigation document describes how to navigate the Macro Tools.
Instructions
Step 1 - Select a Region
Data from the NPMRDS tool is available to download in both .csv and .shp files. To begin, click on the left-side under "Geography" and choose a region.

Step 2 - Open the Data Downloader
Once a region is selected, click the green “Open Data Downloader” button in the legend on the top-right of the map.

A new Data Downloader window will overlay the map.
Step 3 - Add Performance Measures
To add a performance measure: In the top-right box titled “Add Performance Measure”, click “Enter a value” and select the desired performance from the drop-down list.

Some performance measures are configurable. Once the desired measure is selected and all configurations are set, click the green “Add Measure” button. The performance measure will now appear in the “Selected Variables” list under “Performance Measures”.
Step 4 - Add Meta Variables
Similarly, to add metadata variables: In the bottom-right box titled “Add TMC Meta Variables”, click “Select a variable...”. Choosing a metadata variable will add it to the list of “Selected Variables" under “Metadata”.

Step 5 - Remove Unwanted Variables
To remove a variable on the list, highlight it and click the “X” to the left of the variable.

Step 6 - Download
Once the desired performance measures and metadata variables have been selected, click the blue “Download as...” box corresponding to the desired file type.

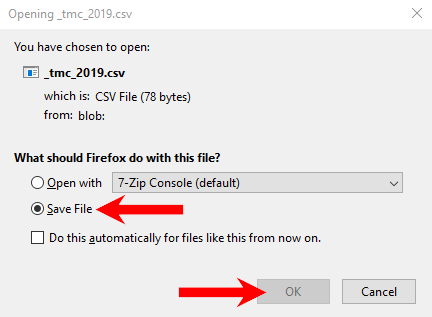
The file will be generated and a new window will pop-up confirm that you wish to download the file. Click “Save File”, then "OK" to download the file (N.B., the download may begin automatically depending on your browser and settings).
Introduction
The following tutorial is designed to walk a user through downloading data from the Macro Tool and performing a sample analysis in Microsoft Excel. The basics of navigating the Macro Tool, Performance Measures, and the Data Downloader can be found in the Map and User Interface Navigation and Downloading Performance Measures documents.
Acquiring Data for External Analysis
Using the Macro Tools Data Downloader, you can select which data points you want to analyze. This tutorial will be using the Left Side Panel to select and download data to analyze the TMC network of Albany County in 2019 using Level of Travel Time Reliability (LOTTR) as a performance measure.
Select the following options using the Left Side Panel drop down menus:

At the bottom of the Right Side Panel, click “Open Data Downloader” and select the following Performance Measure and Metadata Variables:
Performance Measures
- Level of Travel Time Reliability (LOTTR)
- Travel Time Index (TTI)
- Percentage of Epochs Reporting -- PM Peak
- Percentage of Epochs Reporting -- AM Peak
- Percentage of Epochs Reporting -- Off Peak (displays as "Midday")
- TED (Freeflow-based Threshold Speed) (person hours) per mile
- TED (Freeflow-based Threshold Speed) (person hours)
- Freeflow (miles per hour)
- TED (person hours)
Metadata
- Length of Segment (miles)
- Associated Road Name (roadname)
- Direction (direction)
- Functional System(HPMS Attribute 1) (f_system)
- Annual Average Daily Traffic(HPMS Attribute 21) (aadt)
- Associated Street (firstname)
- Alternative Route Name(HPMS Attribute 20) (altrtename)

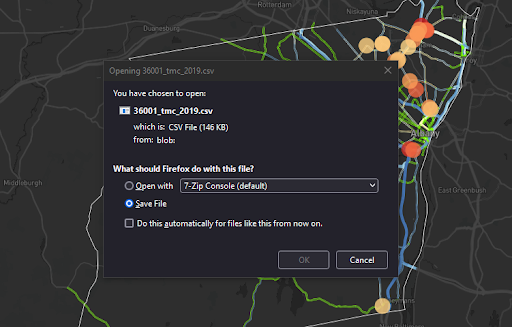
Download this dataset as a .csv file. Once the tool has processed the data selection, an option to download the file will appear. Ensure that "Save File" is selected and click "OK".
To open the data in a way that's manipulable: right-click the file, hover over "Open with", and select "Excel".
Configuring the Data
Rearranging the data columns is not required, with over 1,000 entries in this .csv file, it will help you to shape the data in a way that's easier to read and understand. Begin by moving all of the metadata about the TMCs to the left-hand side of the spreadsheet. In Excel, this entails inserting blank columns before the left-most column then cutting and pasting entire columns of metadata into those blank columns.
In this example, we have adjusted the columns in this order:
tmc
firstmane
altername
roadname
direction
f_system
freeflow
miles
aadt
year
ted_freeflow_ris_per_mi
ted_freeflow_ris
lottr
tti
pct_bins_reporting_am
pct_bins_reporting_pm
pct_bins_reporting_off
Turn this spreadsheet into a table by pressing “Ctrl+A” to select all. With all cells selected, go to “Insert” and click “Table”. Be sure that the box for “My table has headers” is checked and click “Ok”.
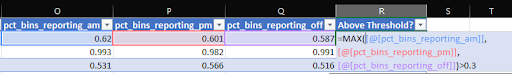
Now that the layout of the data columns are more readable and in table format, you will filter for data quality. You will keep only the TMCs that have at least one peak with 30% of epochs reporting. To do this, you're going to make a new column at the right side of the sheet titled "Above Threshold". In the second row, you're going to create an equation to help add up and filter the percent reporting columns.
You want to filter out all TMCs that do not have at least one peak at least 30% reporting by using the three "Percentage of Epochs Reporting" columns; "PM Peak", "AM Peak", and "Midday". To do this, you want to use the MAX equation in Excel to determine whether all three percentages fall below 0.3 or not.
In the first cell of our new column, enter the equation =MAX(O2,P2,Q2)>0.3
In this example:*your columns may differ depending on the arrangement you did in the previous step*
- O2 is the first data cell in the "pct_bins_reporting_pm" column.
- P2 is the first data cell in the "pct_bins_reporting_am" column.
- Q2 is the first data cell in the "pct_bins_reporting_off" column.
Using this equation "=MAX(O2,P2,Q2)" will return the largest number in the selected set of values, then ">0.3" will determine if the percent reporting in at least one of those columns is above 30% (True) or all are below 30% (False).
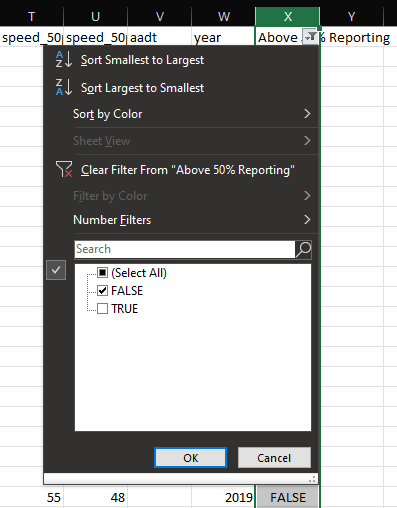
When converting the data to a table format, the formula will be performed for each row and the headers at the top of each column will have a filter button.
In the “Above Threshold” column, filter out all of the "TRUE", or less than 30% reporting, entries by clicking the filter arrow in the header cell, deselecting "TRUE", and clicking "OK".
Now that you have filtered out all of the TRUE (Above 30% Reporting) entries, select all visible rows, right click anywhere on the table, hover over “Delete” and click “Table Rows”. This will remove all of the TMCs below 30% reporting from the list.
Go back to the “Above Threshold” filter and check “TRUE” to unhide these rows. Now every entry in this spreadsheet is a TMC that has at least one category of percent reporting as 30% or higher. Once this is complete, the three "Percent Epochs Reporting" and the "Above Threshold" columns have served their purpose; if desired, hide them to reduce the number of columns visible.
Now that the data has been filtered down to the desired TMCs, let’s add six new columns; two columns to the right of “ted_ris_freeflow_per_mi”, two to the right of “tti”, and two to the right of “lottr”. Each performance measure will get a normalization column and a rank column so we’ll title the headers:
tedNORM
tedRANK
ttiNORM
ttiRANK
lottrNORM
lottrRANK
In the first open cell of each new NORM column, you are going to use an equation that normalizes the values in the entire column:=1+4*(([@[ted_freeflow_ris_per_mi]])-MIN(L:L))/(MAX(L:L)-MIN(L:L))
In these example equations, the user can type “=1+4*(“ and then click the desired column to autofill the header in the correct format, then type the remainder of the equation ”)-MIN(L:L))/(MAX(L:L)-MIN(L:L))”. Additionally the letters in the parentheses correspond to the columns that are being normalized. For example:
- The “L” in the “=1+4*(([@[ted_freeflow_ris_per_mi]])-MIN(L:L))/(MAX(L:L)-MIN(L:L))” formula is the “ted_freeflow_ris_per_mi” column
Then repeat for the other NORM columns:
=1+4*(([@tti])-MIN(O:O))/(MAX(O:O)-MIN(O:O))
=1+4*(([@lottr])-MIN(R:R))/(MAX(R:R)-MIN(R:R))- The “O” in the “=1+4*(([@tti])-MIN(O:O))/(MAX(O:O)-MIN(O:O))“= formula is the “tti” column.
- The “R” in the “=1+4*(([@lottr])-MIN(R:R))/(MAX(R:R)-MIN(R:R))” formula is the “lottr” column.
These equations are going to “normalize” all of the values in the entire column by converting the highest value to a “5” and the lowest value to a “1”. The rest of the values will range between these two numbers. This creates a smaller number set that can be used to compare with other values that have been normalized, but retains the unique value when compared to others in the same performance measure.
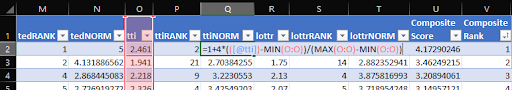
Next you're going to use the following equations in our new performance measure RANK columns to rank all of the performance measures in ascending order:
=Rank((ted_freeflow_ris_per_mi),L:L,0)
=Rank((tti),O:O,0)
=Rank((lottr),R:R,0)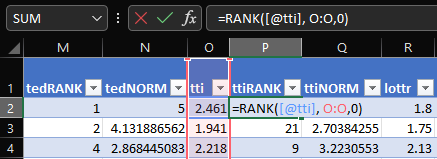
Once this process is completed for each performance measure, the user should have normalized scores and ranks for all the variables they wish to use in their composite score.
Create two columns: Composite Score and Composite Rank
The Composite Score factors in the potential for an analyst to weight certain measures heavier than others with the format: (Normalized Measure * Weight). The column will have the following equation:
=([@[lottr normalized]]*0.5)+([@[tti normalized]]*0.5)+([@[ted_freeflow_per_mi normalized]]*0.5)
This equation is displayed vertically below, broken into its pieces to provide an easier-to-understand format.
=
([@[lottr normalized]]*0.5)
+
([@[tti normalized]]*0.5)
+
([@[ted_freeflow_per_mi normalized]]*0.5)
Adjust the "0.5" value within the equation for each performance measure to the desired weight--relative to the other measures' weights.
The Composite Rank column uses the same rank equation used for each performance measure:
=RANK([@[Composite Score]], Y:Y, 0)
Once the calculation creates the ranks, sort the sheet from smallest to largest Composite Rank. The finished sheet is now a list of TMCs with all desired performance measure scores accounted for and ranked.
Annual Average of Daily Traffic (AADT) (RIS) -- Current Year Estimate
Measure Definition
An estimate of AADT for the last full calendar year ("current year"). These numbers are typically generated in late Spring/early Summer for the prior calendar year.
Annual Average of Daily Traffic (AADT) (RIS) -- Actual
Measure Definition
Annual Average of Daily Traffic based on the last count taken on the roadway segment.
Annual Average of Daily Traffic (AADT) (RIS) -- Single Unit Trucks
Measure Definition
The number of single unit trucks (classes 4-7) in an average day of the year.
Annual Average of Daily Traffic (AADT) (RIS) -- Combination Trucks
Measure Definition
The number of combination trucks (classes 8-13) in an average day of the year.
Posted Speed Limit (RIS)
Measure Definition
Posted speed limit.
Directional Design Hourly Volume (DDHV) (RIS)
Measure Definition
Estimate of the Directional Design Hour Volume calculated by applying DDHV factors derived from determining the ratio of the weekday high hour of the latest local count to the weekday average daily traffic.
Directional Design Hourly Volume Factor (RIS)
Measure Definition
Estimate of the Directional Design Hour Volume calculated by applying DDHV factors derived from statewide continuous count data.
Adjusted Rated Capacity (RIS)
Measure Definition
Adjusted rated capacity (one way).
Volume to Capacity Ratio (RIS)
Measure Definition
Volume to capacity ratio (DDHV / ARC).
K Factor (RIS)
Measure Definition
A calculated field indicating the proportion of the AADT that occurs in the peak direction of the highest hour.
D Factor (RIS)
Measure Definition
A calculated field indicating the proportion of the traffic heading in the higher volume direction in the high hour.
*Annual Average of Daily Traffic (AADT) (NPMRDS)
Measure Definition
Annual Average of Daily Traffic based on the last count taken on the roadway segment.
*Annual Average of Daily Traffic (AADT) (NPMRDS) -- Single Unit Trucks
Measure Definition
The number of single unit trucks (classes 4-7) in an average day of the year.
*Annual Average of Daily Traffic (AADT) (NPMRDS) -- Combination Trucks
Measure Definition
The number of combination trucks (classes 8-13) in an average day of the year.
*Average Vehicle Occupancy (NPMRDS)
Measure Definition
The average quantity of persons in a vehicle.
*Average Speed Limit (NPMRDS)
Measure Definition
The average speed limit across all selected TMCs.
Freeflow (miles per hour)
Measure Definition
- The theoretical speed when density and flow rate on a study segment are both zero.
- The prevailing speed on freeways at flow rates between 0 and 1,000 passenger cars per hour per lane (pc/h/ln) (HCM, 2010a).
Measure Equation
85th percentile of off-peak travel speeds
Measure Time Periods
Off-peak periods: Monday through Friday, 9am to 4pm and 7pm to 10pm; Saturday and Sunday, 6am to 10pm
Level of Travel Time Reliability (LOTTR)
Measure Definition
The 80th percentile travel time over 50th percentile travel time for each segment of road during peak travel times.
Measure Equation
80th/50th percentile travel times.
Measure Time Periods
Weekdays 6-10am, 10am-4pm, 4pm-8pm; weekends 6am-8pm.
Level of Travel Time Reliability (LOTTR) -- AM Peak
Measure Definition
The 80th percentile travel time over 50th percentile travel time for each segment of road during weekday AM peak travel times.
Measure Equation
80th/50th percentile travel times.
Measure Time Periods
Weekdays 6-10am.
Level of Travel Time Reliability (LOTTR) -- Midday
Measure Definition
The 80th percentile travel time over 50th percentile travel time for each segment of road during weekday midday travel times.
Measure Equation
80th/50th percentile travel times.
Measure Time Periods
Weekdays 10am-4pm.
Level of Travel Time Reliability (LOTTR) -- PM Peak
Measure Definition
The 80th percentile travel time over 50th percentile travel time for each segment of road during weekday PM peak travel times.
Measure Equation
80th/50th percentile travel times.
Measure Time Periods
Weekdays 4pm-8pm.
Level of Travel Time Reliability (LOTTR) -- Weekend
Measure Definition
The 80th percentile travel time over 50th percentile travel time for each segment of road during weekend travel times.
Measure Equation
80th/50th percentile travel times.
Measure Time Periods
Weekends 6am-8pm.
Truck Travel Time Reliability (TTTR)
Measure Definition
Truck Travel Time Reliability measure (ratio).
Measure Equation
95th /50th percentile travel times.
Measure Time Periods
Weekdays 6-10am, 10am-4pm, 4pm-8pm; all days 8pm-6am; weekends 6am-8pm.
Truck Travel Time Reliability (TTTR) -- AM Peak
Measure Definition
Truck Travel Time Reliability measure (ratio).
Measure Equation
95th /50th percentile travel times during weekday AM peak hours.
Measure Time Periods
Weekdays 6-10am.
Truck Travel Time Reliability (TTTR) -- Midday
Measure Definition
Truck Travel Time Reliability measure (ratio).
Measure Equation
95th/50th percentile travel times during weekday midday hours.
Measure Time Periods
Weekdays 10am-4pm.
Truck Travel Time Reliability (TTTR) -- PM Peak
Measure Definition
Truck Travel Time Reliability measure (ratio).
Measure Equation
95th/50th percentile travel times during weekday PM peak hours.
Measure Time Periods
Weekdays 4pm-8pm.
Truck Travel Time Reliability (TTTR) -- Overnight
Measure Definition
Truck Travel Time Reliability measure (ratio).
Measure Equation
95th /50th percentile travel times during overnight hours.
Measure Time Periods
All days 8pm-6am.
Truck Travel Time Reliability (TTTR) -- Weekend
Measure Definition
Truck Travel Time Reliability measure (ratio).
Measure Equation
95th/50th percentile travel times during weekend non-overnight hours.
Measure Time Periods
Weekends 6am-8pm.
PHED (person hours)
Measure Definition
Excessive delay means the extra amount of time spent in congested conditions defined by speed thresholds that are lower than a normal delay threshold. For the purposes of this rule, the speed threshold is 20 miles per hour or 60 percent of the posted speed limit, whichever is greater.
Measure Time Periods
Weekdays only 6-10am (AM peak); 3-7pm (PM peak).
PHED (person hours) -- AM Peak
Measure Definition
Excessive delay means the extra amount of time spent in congested conditions defined by speed thresholds that are lower than a normal delay threshold. For the purposes of this rule, the speed threshold is 20 miles per hour or 60 percent of the posted speed limit, whichever is greater.
Measure Time Periods
Weekdays only 6-10am (AM peak).
PHED (person hours) -- PM Peak
Measure Definition
Excessive delay means the extra amount of time spent in congested conditions defined by speed thresholds that are lower than a normal delay threshold. For the purposes of this rule, the speed threshold is 20 miles per hour or 60 percent of the posted speed limit, whichever is greater.
Measure Time Periods
Weekdays only 3-7pm (PM peak).
PHED (vehicle hours)
Measure Definition
Excessive delay means the extra amount of time spent in congested conditions defined by speed thresholds that are lower than a normal delay threshold. For the purposes of this rule, the speed threshold is 20 miles per hour or 60 percent of the posted speed limit, whichever is greater.
Measure Time Periods
Weekdays only 6-10am (AM peak); 3-7pm (PM peak).
PHED (vehicle hours) -- AM Peak
Measure Definition
Excessive delay means the extra amount of time spent in congested conditions defined by speed thresholds that are lower than a normal delay threshold. For the purposes of this rule, the speed threshold is 20 miles per hour or 60 percent of the posted speed limit, whichever is greater.
Measure Time Periods
Weekdays only 6-10am (AM peak).
PHED (vehicle hours) -- PM Peak
Measure Definition
Excessive delay means the extra amount of time spent in congested conditions defined by speed thresholds that are lower than a normal delay threshold. For the purposes of this rule, the speed threshold is 20 miles per hour or 60 percent of the posted speed limit, whichever is greater.
Measure Time Periods
Weekdays only 3-7pm (PM peak).
PHED (person hours) per mile
Measure Definition
Excessive delay means the extra amount of time spent in congested conditions defined by speed thresholds that are lower than a normal delay threshold. For the purposes of this rule, the speed threshold is 20 miles per hour or 60 percent of the posted speed limit, whichever is greater. Peak Hour Excessive Delay is then calculated per mile of total segment length.
Measure Time Periods
Weekdays only 6-10am (AM peak); 3-7pm (PM peak).
PHED (person hours) per mile -- AM Peak
Measure Definition
Excessive delay means the extra amount of time spent in congested conditions defined by speed thresholds that are lower than a normal delay threshold. For the purposes of this rule, the speed threshold is 20 miles per hour or 60 percent of the posted speed limit, whichever is greater. Peak Hour Excessive Delay is then calculated per mile of total segment length.
Measure Time Periods
weekdays only 6-10am (AM peak)
PHED (person hours) per mile -- PM Peak
Measure Definition
Excessive delay means the extra amount of time spent in congested conditions defined by speed thresholds that are lower than a normal delay threshold. For the purposes of this rule, the speed threshold is 20 miles per hour or 60 percent of the posted speed limit, whichever is greater. Peak Hour Excessive Delay is then calculated per mile of total segment length.
Measure Time Periods
weekdays 3-7pm (PM peak)
PHED (vehicle hours) per mile
Measure Definition
Excessive delay means the extra amount of time spent in congested conditions defined by speed thresholds that are lower than a normal delay threshold. For the purposes of this rule, the speed threshold is 20 miles per hour or 60 percent of the posted speed limit, whichever is greater. Peak Hour Excessive Delay is then calculated per mile of total segment length.
Measure Time Periods
weekdays only 6-10am (AM peak) & 3-7pm (PM peak)
PHED (vehicle hours) per mile -- AM Peak
Measure Definition
Excessive delay means the extra amount of time spent in congested conditions defined by speed thresholds that are lower than a normal delay threshold. For the purposes of this rule, the speed threshold is 20 miles per hour or 60 percent of the posted speed limit, whichever is greater. Peak Hour Excessive Delay is then calculated per mile of total segment length.
Measure Time Periods
weekdays only 6-10am (AM peak)
PHED (vehicle hours) per mile -- PM Peak
Measure Definition
Excessive delay means the extra amount of time spent in congested conditions defined by speed thresholds that are lower than a normal delay threshold. For the purposes of this rule, the speed threshold is 20 miles per hour or 60 percent of the posted speed limit, whichever is greater. Peak Hour Excessive Delay is then calculated per mile of total segment length.
Measure Time Periods
weekdays 3-7pm (PM peak)
PHED (Freeflow-based) (person hours)
Measure Definition
Excessive delay means the extra amount of time spent in congested conditions defined by speed thresholds that are lower than a normal delay threshold. For the purposes of this rule, the speed threshold is 20 miles per hour or 60 percent of the freeflow speed, whichever is greater.
Measure Time Periods
weekdays only 6-10am (AM peak) & 3-7pm (PM peak)
PHED (Freeflow-based) (person hours) -- AM Peak
Measure Definition
Excessive delay means the extra amount of time spent in congested conditions defined by speed thresholds that are lower than a normal delay threshold. For the purposes of this rule, the speed threshold is 20 miles per hour or 60 percent of the freeflow speed, whichever is greater.
Measure Time Periods
weekdays only 6-10am (AM peak)
PHED (Freeflow-based) (person hours) -- PM Peak
Measure Definition
Excessive delay means the extra amount of time spent in congested conditions defined by speed thresholds that are lower than a normal delay threshold. For the purposes of this rule, the speed threshold is 20 miles per hour or 60 percent of the freeflow speed, whichever is greater.
Measure Time Periods
weekdays only 3-7pm (PM peak)
PHED (Freeflow-based) (vehicle hours)
Measure Definition
Excessive delay means the extra amount of time spent in congested conditions defined by speed thresholds that are lower than a normal delay threshold. For the purposes of this rule, the speed threshold is 20 miles per hour or 60 percent of the freeflow speed, whichever is greater.
Measure Time Periods
weekdays only 6-10am (AM peak) & 3-7pm (PM peak)
PHED (Freeflow-based) (vehicle hours) -- AM Peak
Measure Definition
Excessive delay means the extra amount of time spent in congested conditions defined by speed thresholds that are lower than a normal delay threshold. For the purposes of this rule, the speed threshold is 20 miles per hour or 60 percent of the freeflow speed, whichever is greater.
Measure Time Periods
weekdays only 6-10am (AM peak)
PHED (Freeflow-based) (vehicle hours) -- PM Peak
Measure Definition
Excessive delay means the extra amount of time spent in congested conditions defined by speed thresholds that are lower than a normal delay threshold. For the purposes of this rule, the speed threshold is 20 miles per hour or 60 percent of the freeflow speed, whichever is greater.
Measure Time Periods
weekdays only 3-7pm (PM peak)
PHED (Freeflow-based) (person hours) per mile
Measure Definition
Excessive delay means the extra amount of time spent in congested conditions defined by speed thresholds that are lower than a normal delay threshold. For the purposes of this rule, the speed threshold is 20 miles per hour or 60 percent of the freeflow speed, whichever is greater.
Measure Time Periods
weekdays only 6-10am (AM peak) & 3-7pm (PM peak)
PHED (Freeflow-based) (person hours) per mile -- AM Peak
Measure Definition
Excessive delay means the extra amount of time spent in congested conditions defined by speed thresholds that are lower than a normal delay threshold. For the purposes of this rule, the speed threshold is 20 miles per hour or 60 percent of the freeflow speed, whichever is greater.
Measure Time Periods
weekdays only 6-10am (AM peak)
PHED (Freeflow-based) (person hours) per mile -- PM Peak
Measure Definition
Excessive delay means the extra amount of time spent in congested conditions defined by speed thresholds that are lower than a normal delay threshold. For the purposes of this rule, the speed threshold is 20 miles per hour or 60 percent of the freeflow speed, whichever is greater.
Measure Time Periods
weekdays 3-7pm (PM peak)
PHED (Freeflow-based) (vehicle hours) per mile
Measure Definition
Excessive delay means the extra amount of time spent in congested conditions defined by speed thresholds that are lower than a normal delay threshold. For the purposes of this rule, the speed threshold is 20 miles per hour or 60 percent of the freeflow speed, whichever is greater.
Measure Time Periods
weekdays only 6-10am (AM peak) & 3-7pm (PM peak)
PHED (Freeflow-based) (vehicle hours) per mile -- AM Peak
Measure Definition
Excessive delay means the extra amount of time spent in congested conditions defined by speed thresholds that are lower than a normal delay threshold. For the purposes of this rule, the speed threshold is 20 miles per hour or 60 percent of the freeflow speed, whichever is greater.
Measure Time Periods
weekdays only 6-10am (AM peak)
PHED (Freeflow-based) (vehicle hours) per mile -- PM Peak
Measure Definition
Excessive delay means the extra amount of time spent in congested conditions defined by speed thresholds that are lower than a normal delay threshold. For the purposes of this rule, the speed threshold is 20 miles per hour or 60 percent of the freeflow speed, whichever is greater.
Measure Time Periods
weekdays 3-7pm (PM peak)
==DRAFT== PHED RIS (person hours)
Measure Definition
Excessive delay means the extra amount of time spent in congested conditions defined by speed thresholds that are lower than a normal delay threshold. For the purposes of this rule, the speed threshold is 20 miles per hour or 60 percent of the posted speed limit, whichever is greater. TMC AADT values are taken from the NYS Road Inventory System shapefile for the respective year. NOTE: The NPMRDS/RIS conflation process is a still under development and computations based on the conflation output are subject to change.
Measure Time Periods
weekdays only 6-10am (AM peak) & 3-7pm (PM peak)
==DRAFT== PHED RIS (person hours) -- AM Peak
Measure Definition
Excessive delay means the extra amount of time spent in congested conditions defined by speed thresholds that are lower than a normal delay threshold. For the purposes of this rule, the speed threshold is 20 miles per hour or 60 percent of the posted speed limit, whichever is greater. TMC AADT values are taken from the NYS Road Inventory System shapefile for the respective year. NOTE: The NPMRDS/RIS conflation process is a still under development and computations based on the conflation output are subject to change.
Measure Time Periods
weekdays only 6-10am (AM peak)
==DRAFT== PHED RIS (person hours) -- PM Peak
Measure Definition
Excessive delay means the extra amount of time spent in congested conditions defined by speed thresholds that are lower than a normal delay threshold. For the purposes of this rule, the speed threshold is 20 miles per hour or 60 percent of the posted speed limit, whichever is greater. TMC AADT values are taken from the NYS Road Inventory System shapefile for the respective year. NOTE: The NPMRDS/RIS conflation process is a still under development and computations based on the conflation output are subject to change.
Measure Time Periods
weekdays only 3-7pm (PM peak)
==DRAFT== PHED RIS (vehicle hours)
Measure Definition
Excessive delay means the extra amount of time spent in congested conditions defined by speed thresholds that are lower than a normal delay threshold. For the purposes of this rule, the speed threshold is 20 miles per hour or 60 percent of the posted speed limit, whichever is greater. TMC AADT values are taken from the NYS Road Inventory System shapefile for the respective year. NOTE: The NPMRDS/RIS conflation process is a still under development and computations based on the conflation output are subject to change.
Measure Time Periods
weekdays only 6-10am (AM peak) & 3-7pm (PM peak)
==DRAFT== PHED RIS (vehicle hours) -- AM Peak
Measure Definition
Excessive delay means the extra amount of time spent in congested conditions defined by speed thresholds that are lower than a normal delay threshold. For the purposes of this rule, the speed threshold is 20 miles per hour or 60 percent of the posted speed limit, whichever is greater. TMC AADT values are taken from the NYS Road Inventory System shapefile for the respective year. NOTE: The NPMRDS/RIS conflation process is a still under development and computations based on the conflation output are subject to change.
Measure Time Periods
weekdays only 6-10am (AM peak)
==DRAFT== PHED RIS (vehicle hours) -- PM Peak
Measure Definition
Excessive delay means the extra amount of time spent in congested conditions defined by speed thresholds that are lower than a normal delay threshold. For the purposes of this rule, the speed threshold is 20 miles per hour or 60 percent of the posted speed limit, whichever is greater. TMC AADT values are taken from the NYS Road Inventory System shapefile for the respective year. NOTE: The NPMRDS/RIS conflation process is a still under development and computations based on the conflation output are subject to change.
Measure Time Periods
weekdays only 3-7pm (PM peak)
==DRAFT== PHED RIS (person hours) per mile
Measure Definition
Excessive delay means the extra amount of time spent in congested conditions defined by speed thresholds that are lower than a normal delay threshold. For the purposes of this rule, the speed threshold is 20 miles per hour or 60 percent of the posted speed limit, whichever is greater. Peak Hour Excessive Delay is then calculated per mile of total segment length. TMC AADT values are taken from the NYS Road Inventory System shapefile for the respective year. NOTE: The NPMRDS/RIS conflation process is a still under development and computations based on the conflation output are subject to change.
Measure Time Periods
weekdays only 6-10am (AM peak) & 3-7pm (PM peak)
==DRAFT== PHED RIS (person hours) per mile -- AM Peak
Measure Definition
Excessive delay means the extra amount of time spent in congested conditions defined by speed thresholds that are lower than a normal delay threshold. For the purposes of this rule, the speed threshold is 20 miles per hour or 60 percent of the posted speed limit, whichever is greater. Peak Hour Excessive Delay is then calculated per mile of total segment length. TMC AADT values are taken from the NYS Road Inventory System shapefile for the respective year. NOTE: The NPMRDS/RIS conflation process is a still under development and computations based on the conflation output are subject to change.
Measure Time Periods
weekdays only 6-10am (AM peak)
==DRAFT== PHED RIS (person hours) per mile -- PM Peak
Measure Definition
Excessive delay means the extra amount of time spent in congested conditions defined by speed thresholds that are lower than a normal delay threshold. For the purposes of this rule, the speed threshold is 20 miles per hour or 60 percent of the posted speed limit, whichever is greater. Peak Hour Excessive Delay is then calculated per mile of total segment length. TMC AADT values are taken from the NYS Road Inventory System shapefile for the respective year. NOTE: The NPMRDS/RIS conflation process is a still under development and computations based on the conflation output are subject to change.
Measure Time Periods
weekdays 3-7pm (PM peak)
==DRAFT== PHED RIS (vehicle hours) per mile
Measure Definition
Excessive delay means the extra amount of time spent in congested conditions defined by speed thresholds that are lower than a normal delay threshold. For the purposes of this rule, the speed threshold is 20 miles per hour or 60 percent of the posted speed limit, whichever is greater. Peak Hour Excessive Delay is then calculated per mile of total segment length. TMC AADT values are taken from the NYS Road Inventory System shapefile for the respective year. NOTE: The NPMRDS/RIS conflation process is a still under development and computations based on the conflation output are subject to change.
Measure Time Periods
weekdays only 6-10am (AM peak) & 3-7pm (PM peak)
==DRAFT== PHED RIS (vehicle hours) per mile -- AM Peak
Measure Definition
Excessive delay means the extra amount of time spent in congested conditions defined by speed thresholds that are lower than a normal delay threshold. For the purposes of this rule, the speed threshold is 20 miles per hour or 60 percent of the posted speed limit, whichever is greater. Peak Hour Excessive Delay is then calculated per mile of total segment length. TMC AADT values are taken from the NYS Road Inventory System shapefile for the respective year. NOTE: The NPMRDS/RIS conflation process is a still under development and computations based on the conflation output are subject to change.
Measure Time Periods
weekdays only 6-10am (AM peak)
==DRAFT== PHED RIS (vehicle hours) per mile -- PM Peak
Measure Definition
Excessive delay means the extra amount of time spent in congested conditions defined by speed thresholds that are lower than a normal delay threshold. For the purposes of this rule, the speed threshold is 20 miles per hour or 60 percent of the posted speed limit, whichever is greater. Peak Hour Excessive Delay is then calculated per mile of total segment length. TMC AADT values are taken from the NYS Road Inventory System shapefile for the respective year. NOTE: The NPMRDS/RIS conflation process is a still under development and computations based on the conflation output are subject to change.
Measure Time Periods
weekdays 3-7pm (PM peak)
==DRAFT== PHED RIS (Freeflow-based) (person hours)
Measure Definition
Excessive delay means the extra amount of time spent in congested conditions defined by speed thresholds that are lower than a normal delay threshold. For the purposes of this rule, the speed threshold is 20 miles per hour or 60 percent of the freeflow speed, whichever is greater. TMC AADT values are taken from the NYS Road Inventory System shapefile for the respective year. NOTE: The NPMRDS/RIS conflation process is a still under development and computations based on the conflation output are subject to change.
Measure Time Periods
weekdays only 6-10am (AM peak) & 3-7pm (PM peak)
==DRAFT== PHED RIS (Freeflow-based) (person hours) -- AM Peak
Measure Definition
Excessive delay means the extra amount of time spent in congested conditions defined by speed thresholds that are lower than a normal delay threshold. For the purposes of this rule, the speed threshold is 20 miles per hour or 60 percent of the freeflow speed, whichever is greater. TMC AADT values are taken from the NYS Road Inventory System shapefile for the respective year. NOTE: The NPMRDS/RIS conflation process is a still under development and computations based on the conflation output are subject to change.
Measure Time Periods
weekdays only 6-10am (AM peak)
==DRAFT== PHED RIS (Freeflow-based) (person hours) -- PM Peak
Measure Definition
Excessive delay means the extra amount of time spent in congested conditions defined by speed thresholds that are lower than a normal delay threshold. For the purposes of this rule, the speed threshold is 20 miles per hour or 60 percent of the freeflow speed, whichever is greater. TMC AADT values are taken from the NYS Road Inventory System shapefile for the respective year. NOTE: The NPMRDS/RIS conflation process is a still under development and computations based on the conflation output are subject to change.
Measure Time Periods
weekdays only 3-7pm (PM peak)
==DRAFT== PHED RIS (Freeflow-based) (vehicle hours)
Measure Definition
Excessive delay means the extra amount of time spent in congested conditions defined by speed thresholds that are lower than a normal delay threshold. For the purposes of this rule, the speed threshold is 20 miles per hour or 60 percent of the freeflow speed, whichever is greater. TMC AADT values are taken from the NYS Road Inventory System shapefile for the respective year. NOTE: The NPMRDS/RIS conflation process is a still under development and computations based on the conflation output are subject to change.
Measure Time Periods
weekdays only 6-10am (AM peak) & 3-7pm (PM peak)
==DRAFT== PHED RIS (Freeflow-based) (vehicle hours) -- AM Peak
Measure Definition
Excessive delay means the extra amount of time spent in congested conditions defined by speed thresholds that are lower than a normal delay threshold. For the purposes of this rule, the speed threshold is 20 miles per hour or 60 percent of the freeflow speed, whichever is greater. TMC AADT values are taken from the NYS Road Inventory System shapefile for the respective year. NOTE: The NPMRDS/RIS conflation process is a still under development and computations based on the conflation output are subject to change.
Measure Time Periods
weekdays only 6-10am (AM peak)
==DRAFT== PHED RIS (Freeflow-based) (vehicle hours) -- PM Peak
Measure Definition
Excessive delay means the extra amount of time spent in congested conditions defined by speed thresholds that are lower than a normal delay threshold. For the purposes of this rule, the speed threshold is 20 miles per hour or 60 percent of the freeflow speed, whichever is greater. TMC AADT values are taken from the NYS Road Inventory System shapefile for the respective year. NOTE: The NPMRDS/RIS conflation process is a still under development and computations based on the conflation output are subject to change.
Measure Time Periods
weekdays only 3-7pm (PM peak)
==DRAFT== PHED RIS (Freeflow-based) (person hours) per mile
Measure Definition
Excessive delay means the extra amount of time spent in congested conditions defined by speed thresholds that are lower than a normal delay threshold. For the purposes of this rule, the speed threshold is 20 miles per hour or 60 percent of the freeflow speed, whichever is greater. TMC AADT values are taken from the NYS Road Inventory System shapefile for the respective year. NOTE: The NPMRDS/RIS conflation process is a still under development and computations based on the conflation output are subject to change.
Measure Time Periods
weekdays only 6-10am (AM peak) & 3-7pm (PM peak)
==DRAFT== PHED RIS (Freeflow-based) (person hours) per mile -- AM Peak
Measure Definition
Excessive delay means the extra amount of time spent in congested conditions defined by speed thresholds that are lower than a normal delay threshold. For the purposes of this rule, the speed threshold is 20 miles per hour or 60 percent of the freeflow speed, whichever is greater. TMC AADT values are taken from the NYS Road Inventory System shapefile for the respective year. NOTE: The NPMRDS/RIS conflation process is a still under development and computations based on the conflation output are subject to change.
Measure Time Periods
weekdays only 6-10am (AM peak)
==DRAFT== PHED RIS (Freeflow-based) (person hours) per mile -- PM Peak
Measure Definition
Excessive delay means the extra amount of time spent in congested conditions defined by speed thresholds that are lower than a normal delay threshold. For the purposes of this rule, the speed threshold is 20 miles per hour or 60 percent of the freeflow speed, whichever is greater. TMC AADT values are taken from the NYS Road Inventory System shapefile for the respective year. NOTE: The NPMRDS/RIS conflation process is a still under development and computations based on the conflation output are subject to change.
Measure Time Periods
weekdays 3-7pm (PM peak)
==DRAFT== PHED RIS (Freeflow-based) (vehicle hours) per mile
Measure Definition
Excessive delay means the extra amount of time spent in congested conditions defined by speed thresholds that are lower than a normal delay threshold. For the purposes of this rule, the speed threshold is 20 miles per hour or 60 percent of the freeflow speed, whichever is greater. TMC AADT values are taken from the NYS Road Inventory System shapefile for the respective year. NOTE: The NPMRDS/RIS conflation process is a still under development and computations based on the conflation output are subject to change.
Measure Time Periods
weekdays only 6-10am (AM peak) & 3-7pm (PM peak)
==DRAFT== PHED RIS (Freeflow-based) (vehicle hours) per mile -- AM Peak
Measure Definition
Excessive delay means the extra amount of time spent in congested conditions defined by speed thresholds that are lower than a normal delay threshold. For the purposes of this rule, the speed threshold is 20 miles per hour or 60 percent of the freeflow speed, whichever is greater. TMC AADT values are taken from the NYS Road Inventory System shapefile for the respective year. NOTE: The NPMRDS/RIS conflation process is a still under development and computations based on the conflation output are subject to change.
Measure Time Periods
weekdays only 6-10am (AM peak)
==DRAFT== PHED RIS (Freeflow-based) (vehicle hours) per mile -- PM Peak
Measure Definition
Excessive delay means the extra amount of time spent in congested conditions defined by speed thresholds that are lower than a normal delay threshold. For the purposes of this rule, the speed threshold is 20 miles per hour or 60 percent of the freeflow speed, whichever is greater. TMC AADT values are taken from the NYS Road Inventory System shapefile for the respective year. NOTE: The NPMRDS/RIS conflation process is a still under development and computations based on the conflation output are subject to change.
Measure Time Periods
weekdays 3-7pm (PM peak)
TED (person hours)
Measure Definition
Excessive delay means the extra amount of time spent in congested conditions defined by speed thresholds that are lower than a normal delay threshold. For the purposes of this rule, the speed threshold is 20 miles per hour or 60 percent of the posted speed limit, whichever is greater.
Measure Time Periods
None. All days and times of day included.
TED (vehicle hours)
Measure Definition
Excessive delay means the extra amount of time spent in congested conditions defined by speed thresholds that are lower than a normal delay threshold. For the purposes of this rule, the speed threshold is 20 miles per hour or 60 percent of the posted speed limit, whichever is greater.
Measure Time Periods
None. All days and times of day included.
TED (person hours) per mile
Measure Definition
Excessive delay means the extra amount of time spent in congested conditions defined by speed thresholds that are lower than a normal delay threshold. For the purposes of this rule, the speed threshold is 20 miles per hour or 60 percent of the posted speed limit, whichever is greater. Peak Hour Excessive Delay is then calculated per mile of total segment length.
Measure Time Periods
None. All days and times of day included.
TED (vehicle hours) per mile
Measure Definition
Excessive delay means the extra amount of time spent in congested conditions defined by speed thresholds that are lower than a normal delay threshold. For the purposes of this rule, the speed threshold is 20 miles per hour or 60 percent of the posted speed limit, whichever is greater. Peak Hour Excessive Delay is then calculated per mile of total segment length.
Measure Time Periods
None. All days and times of day included.
TED (Freeflow-based) (person hours)
Measure Definition
Excessive delay means the extra amount of time spent in congested conditions defined by speed thresholds that are lower than a normal delay threshold. For the purposes of this rule, the speed threshold is 20 miles per hour or 60 percent of the freeflow speed, whichever is greater.
Measure Time Periods
None. All days and times of day included.
TED (Freeflow-based) (vehicle hours)
Measure Definition
Excessive delay means the extra amount of time spent in congested conditions defined by speed thresholds that are lower than a normal delay threshold. For the purposes of this rule, the speed threshold is 20 miles per hour or 60 percent of the freeflow speed, whichever is greater.
Measure Time Periods
None. All days and times of day included.
TED (Freeflow-based) (person hours) per mile
Measure Definition
Excessive delay means the extra amount of time spent in congested conditions defined by speed thresholds that are lower than a normal delay threshold. For the purposes of this rule, the speed threshold is 20 miles per hour or 60 percent of the freeflow speed, whichever is greater.
Measure Time Periods
None. All days and times of day included.
TED (Freeflow-based) (vehicle hours) per mile
Measure Definition
Excessive delay means the extra amount of time spent in congested conditions defined by speed thresholds that are lower than a normal delay threshold. For the purposes of this rule, the speed threshold is 20 miles per hour or 60 percent of the freeflow speed, whichever is greater.
Measure Time Periods
None. All days and times of day included.
==DRAFT== TED RIS (person hours)
Measure Definition
Excessive delay means the extra amount of time spent in congested conditions defined by speed thresholds that are lower than a normal delay threshold. For the purposes of this rule, the speed threshold is 20 miles per hour or 60 percent of the posted speed limit, whichever is greater. TMC AADT values are taken from the NYS Road Inventory System shapefile for the respective year. NOTE: The NPMRDS/RIS conflation process is a still under development and computations based on the conflation output are subject to change.
Measure Time Periods
None. All days and times of day included.
==DRAFT== TED RIS (vehicle hours)
Measure Definition
Excessive delay means the extra amount of time spent in congested conditions defined by speed thresholds that are lower than a normal delay threshold. For the purposes of this rule, the speed threshold is 20 miles per hour or 60 percent of the posted speed limit, whichever is greater. TMC AADT values are taken from the NYS Road Inventory System shapefile for the respective year. NOTE: The NPMRDS/RIS conflation process is a still under development and computations based on the conflation output are subject to change.
Measure Time Periods
None. All days and times of day included.
==DRAFT== TED RIS (person hours) per mile
Measure Definition
Excessive delay means the extra amount of time spent in congested conditions defined by speed thresholds that are lower than a normal delay threshold. For the purposes of this rule, the speed threshold is 20 miles per hour or 60 percent of the posted speed limit, whichever is greater. Peak Hour Excessive Delay is then calculated per mile of total segment length. TMC AADT values are taken from the NYS Road Inventory System shapefile for the respective year. NOTE: The NPMRDS/RIS conflation process is a still under development and computations based on the conflation output are subject to change.
Measure Time Periods
None. All days and times of day included.
==DRAFT== TED RIS (vehicle hours) per mile
Measure Definition
Excessive delay means the extra amount of time spent in congested conditions defined by speed thresholds that are lower than a normal delay threshold. For the purposes of this rule, the speed threshold is 20 miles per hour or 60 percent of the posted speed limit, whichever is greater. Peak Hour Excessive Delay is then calculated per mile of total segment length. TMC AADT values are taken from the NYS Road Inventory System shapefile for the respective year. NOTE: The NPMRDS/RIS conflation process is a still under development and computations based on the conflation output are subject to change.
Measure Time Periods
None. All days and times of day included.
==DRAFT== TED RIS (Freeflow-based) (person hours)
Measure Definition
Excessive delay means the extra amount of time spent in congested conditions defined by speed thresholds that are lower than a normal delay threshold. For the purposes of this rule, the speed threshold is 20 miles per hour or 60 percent of the freeflow speed, whichever is greater. TMC AADT values are taken from the NYS Road Inventory System shapefile for the respective year. NOTE: The NPMRDS/RIS conflation process is a still under development and computations based on the conflation output are subject to change.
Measure Time Periods
None. All days and times of day included.
==DRAFT== TED RIS (Freeflow-based) (vehicle hours)
Measure Definition
Excessive delay means the extra amount of time spent in congested conditions defined by speed thresholds that are lower than a normal delay threshold. For the purposes of this rule, the speed threshold is 20 miles per hour or 60 percent of the freeflow speed, whichever is greater. TMC AADT values are taken from the NYS Road Inventory System shapefile for the respective year. NOTE: The NPMRDS/RIS conflation process is a still under development and computations based on the conflation output are subject to change.
Measure Time Periods
None. All days and times of day included.
==DRAFT== TED RIS (Freeflow-based) (person hours) per mile
Measure Definition
Excessive delay means the extra amount of time spent in congested conditions defined by speed thresholds that are lower than a normal delay threshold. For the purposes of this rule, the speed threshold is 20 miles per hour or 60 percent of the freeflow speed, whichever is greater. TMC AADT values are taken from the NYS Road Inventory System shapefile for the respective year. NOTE: The NPMRDS/RIS conflation process is a still under development and computations based on the conflation output are subject to change.
Measure Time Periods
None. All days and times of day included.
==DRAFT== TED RIS (Freeflow-based) (vehicle hours) per mile
Measure Definition
Excessive delay means the extra amount of time spent in congested conditions defined by speed thresholds that are lower than a normal delay threshold. For the purposes of this rule, the speed threshold is 21 miles per hour or 60 percent of the freeflow speed, whichever is greater. TMC AADT values are taken from the NYS Road Inventory System shapefile for the respective year. NOTE: The NPMRDS/RIS conflation process is a still under development and computations based on the conflation output are subject to change.
Measure Time Periods
None. All days and times of day included.
Planning Time Index (PTI)
Measure Definition
95th precentile cross-peak travel time / freeflow travel time
Measure Equation
95th percentile cross-peak peak (AM Peak & PM Peak) travel time / freeflow travel time
Measure Time Periods
weekdays 6am-9am and 4pm-7pm
Planning Time Index (PTI) -- Max Peak
Measure Definition
Max(AM peak 95% travel time, PM peak 95% travel time) / freeflow travel time
Measure Equation
Max(AM peak 95% travel time, PM peak 95% travel time) / freeflow travel time
Measure Time Periods
weekdays 6am-9am and 4pm-7pm
Planning Time Index (PTI) -- AM Peak
Measure Definition
AM Peak 95% travel time / freeflow travel time
Measure Equation
AM Peak 95% travel time / freeflow travel time
Measure Time Periods
weekdays 6am-9am
Planning Time Index (PTI) -- PM Peak
Measure Definition
PM Peak 95% travel time / freeflow travel time
Measure Equation
PM Peak 95% travel time / freeflow travel time
Measure Time Periods
weekdays 4pm-7pm
Travel Time Index (TTI)
Measure Definition
Average cross-peak travel time / freeflow travel time
Measure Equation
Average cross-peak peak (AM Peak & PM Peak) travel time / freeflow travel time
Measure Time Periods
weekdays 6am-9am and 4pm-7pm
Travel Time Index (TTI) -- Max Peak
Measure Definition
Max(AM Peak Avg Travel Time, PM Peak Avg Travel Time) / Freeflow Travel Time
Measure Equation
Max(AM Peak Avg Travel Time, PM Peak Avg Travel Time) / Freeflow Travel Time
Measure Time Periods
weekdays 6am-9am and 4pm-7pm
Travel Time Index (TTI) -- AM Peak
Measure Definition
Ratio of average AM peak travel time over freeflow travel time
Measure Equation
AM Peak Avg Travel Time / Freeflow Travel Time
Measure Time Periods
weekdays 6am-9am
Travel Time Index (TTI) -- PM Peak
Measure Definition
Ratio of average PM peak travel time over freeflow travel time
Measure Equation
PM Peak Avg Travel Time / Freeflow Travel Time
Measure Time Periods
weekdays 4pm-7pm
Percentage of Epochs Reporting -- Total
Measure Definition
The percentage of 5-minute epochs reporting data for the road segment across the year.
Measure Equation
Number of epochs reporting data / Number of epochs for year
Measure Time Periods
weekdays & weekends, all epochs
Percentage of Epochs Reporting -- AM Peak
Measure Definition
The percentage of AM peak 5-minute epochs reporting data for the road segment across the year.
Measure Equation
Number of epochs reporting data within AM peak / Number of epochs within AM peak for year
Measure Time Periods
weekdays 6-10am
Percentage of Epochs Reporting -- Midday
Measure Definition
The percentage of Midday 5-minute epochs reporting data for the road segment across the year.
Measure Equation
Number of Midday epochs reporting data within peak / Number of Midday epochs within peak for year
Measure Time Periods
weekdays 10am-4pm
Percentage of Epochs Reporting -- PM Peak
Measure Definition
The percentage of 5-minute epochs reporting data for the road segment across the year.
Measure Equation
Number of PM peak epochs reporting data within peak / Number of PM peak epochs within peak for year
Measure Time Periods
weekdays 4pm-8pm
Percentage of Epochs Reporting -- Overnight
Measure Definition
The percentage of Overnight 5-minute epochs reporting data for the road segment across the year.
Measure Equation
Number of Overnight epochs reporting data within peak / Number of Overnight epochs within peak for year
Measure Time Periods
all days 8pm-6am
Percentage of Epochs Reporting -- Weekend
Measure Definition
The percentage of Weekend 5-minute epochs reporting data for the road segment across the year.
Measure Equation
Number of Weekend epochs reporting data within peak / Number of Weekend epochs within peak for year
Measure Time Periods
weekends 6am-8pm
LOTTR 80th percentile speed AM Peak
Measure Definition
80th percentile travel time of bins reporting for am peak
LOTTR 80th percentile speed PM Peak
Measure Definition
80th percentile travel time of bins reporting for pm peak
LOTTR 80th percentile speed Weekend Peak
Measure Definition
80th percentile travel time of bins reporting for weekend peak
LOTTR 80th percentile travel time Midday Peak
Measure Definition
80th percentile travel time of bins reporting for midday peak
Percentile Speed (5th) -- AM Peak
Measure Definition
The 5th percentile speed during the AM peak.
Measure Time Periods
weekdays 6-10am
Percentile Speed (20th) -- AM Peak
Measure Definition
The 20th percentile speed during the AM peak.
Measure Time Periods
weekdays 6-10am
Percentile Speed (25th) -- AM Peak
Measure Definition
The 25th percentile speed during the AM peak.
Measure Time Periods
weekdays 6-10am
Percentile Speed (50th) -- AM Peak
Measure Definition
The 50th percentile speed during the AM peak.
Measure Time Periods
weekdays 6-10am
Percentile Speed (75th) -- AM Peak
Measure Definition
The 75th percentile speed during the AM peak.
Measure Time Periods
weekdays 6-10am
Percentile Speed (80th) -- AM Peak
Measure Definition
The 80th percentile speed during the AM peak.
Measure Time Periods
weekdays 6-10am
Percentile Speed (85th) -- AM Peak
Measure Definition
The 85th percentile speed during the AM peak.
Measure Time Periods
weekdays 6-10am
Percentile Speed (95th) -- AM Peak
Measure Definition
The 95th percentile speed during the AM peak.
Measure Time Periods
weekdays 6-10am
Percentile Speed (5th) -- Midday Period
Measure Definition
The 5th percentile speed during the midday period.
Measure Time Periods
weekdays 10am-4pm
Percentile Speed (20th) -- Midday Period
Measure Definition
The 20th percentile speed during the midday period.
Measure Time Periods
weekdays 10am-4pm
Percentile Speed (25th) -- Midday Period
Measure Definition
The 25th percentile speed during the midday period.
Measure Time Periods
weekdays 10am-4pm
Percentile Speed (50th) -- Midday Period
Measure Definition
The 50th percentile speed during the midday period.
Measure Time Periods
weekdays 10am-4pm
Percentile Speed (75th) -- Midday Period
Measure Definition
The 75th percentile speed during the midday period.
Measure Time Periods
weekdays 10am-4pm
Percentile Speed (80th) -- Midday Period
Measure Definition
The 80th percentile speed during the midday period.
Measure Time Periods
weekdays 10am-4pm
Percentile Speed (85th) -- Midday Period
Measure Definition
The 85th percentile speed during the midday period.
Measure Time Periods
weekdays 10am-4pm
Percentile Speed (95th) -- Midday Period
Measure Definition
The 95th percentile speed during the midday period.
Measure Time Periods
weekdays 10am-4pm
Percentile Speed (5th) -- PM Peak
Measure Definition
The 5th percentile speed during the PM peak.
Measure Time Periods
weekdays 4pm-8pm
Percentile Speed (20th) -- PM Peak
Measure Definition
The 20th percentile speed during the PM peak.
Measure Time Periods
weekdays 4pm-8pm
Percentile Speed (25th) -- PM Peak
Measure Definition
The 25th percentile speed during the PM peak.
Measure Time Periods
weekdays 4pm-8pm
Percentile Speed (50th) -- PM Peak
Measure Definition
The 50th percentile speed during the PM peak.
Measure Time Periods
weekdays 4pm-8pm
Percentile Speed (75th) -- PM Peak
Measure Definition
The 75th percentile speed during the PM peak.
Measure Time Periods
weekdays 4pm-8pm
Percentile Speed (80th) -- PM Peak
Measure Definition
The 80th percentile speed during the PM peak.
Measure Time Periods
weekdays 4pm-8pm
Percentile Speed (85th) -- PM Peak
Measure Definition
The 85th percentile speed during the PM peak.
Measure Time Periods
weekdays 4pm-8pm
Percentile Speed (95th) -- PM Peak
Measure Definition
The 95th percentile speed during the PM peak.
Measure Time Periods
weekdays 4pm-8pm
Percentile Speed (5th) -- Overnight Period
Measure Definition
The 5th percentile speed during the overnight period.
Measure Time Periods
all days 8pm-6am
Percentile Speed (20th) -- Overnight Period
Measure Definition
The 20th percentile speed during the overnight period.
Measure Time Periods
all days 8pm-6am
Percentile Speed (25th) -- Overnight Period
Measure Definition
The 25th percentile speed during the overnight period.
Measure Time Periods
all days 8pm-6am
Percentile Speed (50th) -- Overnight Period
Measure Definition
The 50th percentile speed during the overnight period.
Measure Time Periods
all days 8pm-6am
Percentile Speed (75th) -- Overnight Period
Measure Definition
The 75th percentile speed during the overnight period.
Measure Time Periods
all days 8pm-6am
Percentile Speed (80th) -- Overnight Period
Measure Definition
The 80th percentile speed during the overnight period.
Measure Time Periods
all days 8pm-6am
Percentile Speed (85th) -- Overnight Period
Measure Definition
The 85th percentile speed during the overnight period.
Measure Time Periods
all days 8pm-6am
Percentile Speed (95th) -- Overnight Period
Measure Definition
The 95th percentile speed during the overnight period.
Measure Time Periods
all days 8pm-6am
Percentile Speed (5th) -- Weekend Period
Measure Definition
The 5th percentile speed during the weekend period.
Measure Time Periods
weekends 6am-8pm
Percentile Speed (20th) -- Weekend Period
Measure Definition
The 20th percentile speed during the weekend period.
Measure Time Periods
weekends 6am-8pm
Percentile Speed (25th) -- Weekend Period
Measure Definition
The 25th percentile speed during the weekend period.
Measure Time Periods
weekends 6am-8pm
Percentile Speed (50th) -- Weekend Period
Measure Definition
The 50th percentile speed during the weekend period.
Measure Time Periods
weekends 6am-8pm
Percentile Speed (75th) -- Weekend Period
Measure Definition
The 75th percentile speed during the weekend period.
Measure Time Periods
weekends 6am-8pm
Percentile Speed (80th) -- Weekend Period
Measure Definition
The 80th percentile speed during the weekend period.
Measure Time Periods
weekends 6am-8pm
Percentile Speed (85th) -- Weekend Period
Measure Definition
The 85th percentile speed during the weekend period.
Measure Time Periods
weekends 6am-8pm
Percentile Speed (95th) -- Weekend Period
Measure Definition
The 95th percentile speed during the weekend period.
Measure Time Periods
weekends 6am-8pm
Percentile Speed (5th) -- Total
Measure Definition
The 5th percentile speed across all times of day and days of the week.
Measure Time Periods
None. All days and times of day included.
Percentile Speed (20th) -- Total
Measure Definition
The 20th percentile speed across all times of day and days of the week.
Measure Time Periods
None. All days and times of day included.
Percentile Speed (25th) -- Total
Measure Definition
The 25th percentile speed across all times of day and days of the week.
Measure Time Periods
None. All days and times of day included.
Percentile Speed (50th) -- Total
Measure Definition
The 50th percentile speed across all times of day and days of the week.
Measure Time Periods
None. All days and times of day included.
Percentile Speed (75th) -- Total
Measure Definition
The 75th percentile speed across all times of day and days of the week.
Measure Time Periods
None. All days and times of day included.
Percentile Speed (80th) -- Total
Measure Definition
The 80th percentile speed across all times of day and days of the week.
Measure Time Periods
None. All days and times of day included.
Percentile Speed (85th) -- Total
Measure Definition
The 85th percentile speed across all times of day and days of the week.
Measure Time Periods
None. All days and times of day included.
Percentile Speed (95th) -- Total
Measure Definition
The 95th percentile speed across all times of day and days of the week.
Measure Time Periods
None. All days and times of day included.
Emissions C0² All Vehicles -- Total
Measure Definition
All Vehicles CO² emissions across all time periods.
Measure Time Periods
All days and times of day included.
Emissions C0² All Vehicles -- AM Peak
Measure Definition
All Vehicles CO² emissions during the AM peak period.
Measure Time Periods
weekdays 6-10am
Emissions C0² All Vehicles -- Midday
Measure Definition
All Vehicles CO² emissions during the midday period.
Measure Time Periods
weekdays 10am-4pm
Emissions C0² All Vehicles -- PM Peak
Measure Definition
All Vehicles CO² emissions during the PM peak period.
Measure Time Periods
weekdays 4pm-8pm
Emissions C0² All Vehicles -- Weekend
Measure Definition
All Vehicles CO² emissions during the weekend period.
Measure Time Periods
weekdays 10am-4pm
Emissions C0² All Vehicles -- Overnight
Measure Definition
All Vehicles CO² emissions during the overnight period.
Measure Time Periods
all days 8pm-6am
Emissions C0² Passenger Vehicles -- Total
Measure Definition
Passenger Vehicles CO² emissions across all time periods.
Measure Time Periods
All days and times of day included.
Emissions C0² Passenger Vehicles -- AM Peak
Measure Definition
Passenger Vehicles CO² emissions during the AM peak period.
Measure Time Periods
weekdays 6-10am
Emissions C0² Passenger Vehicles -- Midday
Measure Definition
Passenger Vehicles CO² emissions during the midday period.
Measure Time Periods
weekdays 10am-4pm
Emissions C0² Passenger Vehicles -- PM Peak
Measure Definition
Passenger Vehicles CO² emissions during the PM peak period.
Measure Time Periods
weekdays 4pm-8pm
Emissions C0² Passenger Vehicles -- Weekend
Measure Definition
Passenger Vehicles CO² emissions during the weekend period.
Measure Time Periods
weekdays 10am-4pm
Emissions C0² Passenger Vehicles -- Overnight
Measure Definition
Passenger Vehicles CO² emissions during the overnight period.
Measure Time Periods
all days 8pm-6am
Emissions C0² Single Unit Trucks and Buses -- Total
Measure Definition
Single Unit Trucks and Buses CO² emissions across all time periods.
Measure Time Periods
All days and times of day included.
Emissions C0² Single Unit Trucks and Buses -- AM Peak
Measure Definition
Single Unit Trucks and Buses CO² emissions during the AM peak period.
Measure Time Periods
weekdays 6-10am
Emissions C0² Single Unit Trucks and Buses -- Midday
Measure Definition
Single Unit Trucks and Buses CO² emissions during the midday period.
Measure Time Periods
weekdays 10am-4pm
Emissions C0² Single Unit Trucks and Buses -- PM Peak
Measure Definition
Single Unit Trucks and Buses CO² emissions during the PM peak period.
Measure Time Periods
weekdays 4pm-8pm
Emissions C0² Single Unit Trucks and Buses -- Weekend
Measure Definition
Single Unit Trucks and Buses CO² emissions during the weekend period.
Measure Time Periods
weekdays 10am-4pm
Emissions C0² Single Unit Trucks and Buses -- Overnight
Measure Definition
Single Unit Trucks and Buses CO² emissions during the overnight period.
Measure Time Periods
all days 8pm-6am
Emissions C0² Combination Trucks -- Total
Measure Definition
Combination Trucks CO² emissions across all time periods.
Measure Time Periods
All days and times of day included.
Emissions C0² Combination Trucks -- AM Peak
Measure Definition
Combination Trucks CO² emissions during the AM peak period.
Measure Time Periods
weekdays 6-10am
Emissions C0² Combination Trucks -- Midday
Measure Definition
Combination Trucks CO² emissions during the midday period.
Measure Time Periods
weekdays 10am-4pm
Emissions C0² Combination Trucks -- PM Peak
Measure Definition
Combination Trucks CO² emissions during the PM peak period.
Measure Time Periods
weekdays 4pm-8pm
Emissions C0² Combination Trucks -- Weekend
Measure Definition
Combination Trucks CO² emissions during the weekend period.
Measure Time Periods
weekdays 10am-4pm
Emissions C0² Combination Trucks -- Overnight
Measure Definition
Combination Trucks CO² emissions during the overnight period.
Measure Time Periods
all days 8pm-6am
Emissions C0² Trucks -- Total
Measure Definition
Trucks CO² emissions during the weekend period.
Measure Time Periods
All days and times of day included.
Emissions C0² Trucks -- AM Peak
Measure Definition
Trucks CO² emissions during the AM peak period.
Measure Time Periods
weekdays 6-10am
Emissions C0² Trucks -- Midday
Measure Definition
Trucks CO² emissions during the midday period.
Measure Time Periods
weekdays 10am-4pm
Emissions C0² Trucks -- PM Peak
Measure Definition
Trucks CO² emissions during the PM peak period.
Measure Time Periods
weekdays 4pm-8pm
Emissions C0² Trucks -- Weekend
Measure Definition
Trucks CO² emissions during the weekend period.
Measure Time Periods
weekdays 10am-4pm
Emissions C0² Trucks -- Overnight
Measure Definition
Trucks CO² emissions during the overnight period.
Measure Time Periods
all days 8pm-6am
Emissions C0² All Vehicles (RIS-based AADT) -- Total
Measure Definition
All Vehicles CO² emissions (RIS-based AADT) across all time periods.
Measure Time Periods
All days and times of day included.
Emissions C0² All Vehicles (RIS-based AADT) -- AM Peak
Measure Definition
All Vehicles CO² emissions (RIS-based AADT) during the AM peak period.
Measure Time Periods
weekdays 6-10am
Emissions C0² All Vehicles (RIS-based AADT) -- Midday
Measure Definition
All Vehicles CO² emissions (RIS-based AADT) during the midday period.
Measure Time Periods
weekdays 10am-4pm
Emissions C0² All Vehicles (RIS-based AADT) -- PM Peak
Measure Definition
All Vehicles CO² emissions (RIS-based AADT) during the PM peak period.
Measure Time Periods
weekdays 4pm-8pm
Emissions C0² All Vehicles (RIS-based AADT) -- Weekend
Measure Definition
All Vehicles CO² emissions (RIS-based AADT) during the weekend period.
Measure Time Periods
weekdays 10am-4pm
Emissions C0² All Vehicles (RIS-based AADT) -- Overnight
Measure Definition
All Vehicles CO² emissions (RIS-based AADT) during the overnight period.
Measure Time Periods
all days 8pm-6am
Emissions C0² Passenger Vehicles (RIS-based AADT) -- Total
Measure Definition
Passenger Vehicles CO² emissions (RIS-based AADT) across all time periods.
Measure Time Periods
All days and times of day included.
Emissions C0² Passenger Vehicles (RIS-based AADT) -- AM Peak
Measure Definition
Passenger Vehicles CO² emissions (RIS-based AADT) during the AM peak period.
Measure Time Periods
weekdays 6-10am
Emissions C0² Passenger Vehicles (RIS-based AADT) -- Midday
Measure Definition
Passenger Vehicles CO² emissions (RIS-based AADT) during the midday period.
Measure Time Periods
weekdays 10am-4pm
Emissions C0² Passenger Vehicles (RIS-based AADT) -- PM Peak
Measure Definition
Passenger Vehicles CO² emissions (RIS-based AADT) during the PM peak period.
Measure Time Periods
weekdays 4pm-8pm
Emissions C0² Passenger Vehicles (RIS-based AADT) -- Weekend
Measure Definition
Passenger Vehicles CO² emissions (RIS-based AADT) during the weekend period.
Measure Time Periods
weekdays 10am-4pm
Emissions C0² Passenger Vehicles (RIS-based AADT) -- Overnight
Measure Definition
Passenger Vehicles CO² emissions (RIS-based AADT) during the overnight period.
Measure Time Periods
all days 8pm-6am
Emissions C0² Single Unit Trucks and Buses (RIS-based AADT) -- Total
Measure Definition
Single Unit Trucks and Buses CO² emissions (RIS-based AADT) across all time periods.
Measure Time Periods
All days and times of day included.
Emissions C0² Single Unit Trucks and Buses (RIS-based AADT) -- AM Peak
Measure Definition
Single Unit Trucks and Buses CO² emissions (RIS-based AADT) during the AM peak period.
Measure Time Periods
weekdays 6-10am
Emissions C0² Single Unit Trucks and Buses (RIS-based AADT) -- Midday
Measure Definition
Single Unit Trucks and Buses CO² emissions (RIS-based AADT) during the midday period.
Measure Time Periods
weekdays 10am-4pm
Emissions C0² Single Unit Trucks and Buses (RIS-based AADT) -- PM Peak
Measure Definition
Single Unit Trucks and Buses CO² emissions (RIS-based AADT) during the PM peak period.
Measure Time Periods
weekdays 4pm-8pm
Emissions C0² Single Unit Trucks and Buses (RIS-based AADT) -- Weekend
Measure Definition
Single Unit Trucks and Buses CO² emissions (RIS-based AADT) during the weekend period.
Measure Time Periods
weekdays 10am-4pm
Emissions C0² Single Unit Trucks and Buses (RIS-based AADT) -- Overnight
Measure Definition
Single Unit Trucks and Buses CO² emissions (RIS-based AADT) during the overnight period.
Measure Time Periods
all days 8pm-6am
Emissions C0² Combination Trucks (RIS-based AADT) -- Total
Measure Definition
Combination Trucks CO² emissions (RIS-based AADT) across all time periods.
Measure Time Periods
All days and times of day included.
Emissions C0² Combination Trucks (RIS-based AADT) -- AM Peak
Measure Definition
Combination Trucks CO² emissions (RIS-based AADT) during the AM peak period.
Measure Time Periods
weekdays 6-10am
Emissions C0² Combination Trucks (RIS-based AADT) -- Midday
Measure Definition
Combination Trucks CO² emissions (RIS-based AADT) during the midday period.
Measure Time Periods
weekdays 10am-4pm
Emissions C0² Combination Trucks (RIS-based AADT) -- PM Peak
Measure Definition
Combination Trucks CO² emissions (RIS-based AADT) during the PM peak period.
Measure Time Periods
weekdays 4pm-8pm
Emissions C0² Combination Trucks (RIS-based AADT) -- Weekend
Measure Definition
Combination Trucks CO² emissions (RIS-based AADT) during the weekend period.
Measure Time Periods
weekdays 10am-4pm
Emissions C0² Combination Trucks (RIS-based AADT) -- Overnight
Measure Definition
Combination Trucks CO² emissions (RIS-based AADT) during the overnight period.
Measure Time Periods
all days 8pm-6am
Emissions C0² Trucks (RIS-based AADT) -- Total
Measure Definition
Trucks CO² emissions (RIS-based AADT) during the weekend period.
Measure Time Periods
All days and times of day included.
Emissions C0² Trucks (RIS-based AADT) -- AM Peak
Measure Definition
Trucks CO² emissions (RIS-based AADT) during the AM peak period.
Measure Time Periods
weekdays 6-10am
Emissions C0² Trucks (RIS-based AADT) -- Midday
Measure Definition
Trucks CO² emissions (RIS-based AADT) during the midday period.
Measure Time Periods
weekdays 10am-4pm
Emissions C0² Trucks (RIS-based AADT) -- PM Peak
Measure Definition
Trucks CO² emissions (RIS-based AADT) during the PM peak period.
Measure Time Periods
weekdays 4pm-8pm
Emissions C0² Trucks (RIS-based AADT) -- Weekend
Measure Definition
Trucks CO² emissions (RIS-based AADT) during the weekend period.
Measure Time Periods
weekdays 10am-4pm
Emissions C0² Trucks (RIS-based AADT) -- Overnight
Measure Definition
Trucks CO² emissions (RIS-based AADT) during the overnight period.
Measure Time Periods
all days 8pm-6am